
The lending landscape experienced another surge in March, marking the second consecutive month of growth as buyers rushed into the market ahead of anticipated cuts to the country’s official cash rate.
According to the latest ABS Lending Indicators seasonally adjusted data, the total value of new home and investment property loans reached $27.64 billion in March, marking a notable 3.1% increase from February.
This surge in new lending activity was predominantly driven by first home buyers, who seized the opportunity to enter the market amidst reduced borrowing power rather than waiting for potential rate cuts.
The value of loans to this group surged by 4.4% over the month to $5.19 billion in March, representing a substantial 17.9% increase compared to the previous year.
Meanwhile, investors also showcased significant activity, with new loans rising by 3.8% from the previous month and a staggering 31.1% compared to the same period last year, totalling $10.17 billion in March.
However, the enthusiasm among upgraders or downsizers was more subdued, with new lending to this group rising by only 2.1% over the month to reach $12.29 billion in new loans settled.
| ABS Lending Indicators – New Lending Activity | |||||||
|
Mar-23 |
Feb-24 |
Mar-24 |
Difference | % Change | |||
| MoM | YoY | MoM | YoY | ||||
| Value of new housing commitments | |||||||
|
Total Housing |
$23.44
billion |
$26.80
billion |
$27.64
billion |
$839.0
million |
$4.20
billion |
3.1% |
17.9% |
| Owner Occupied excl First Home Buyers | $11.29
billion |
$12.04
billion |
$12.29
billion |
$252.7
million |
$998.5
million |
2.1% |
8.8% |
|
Investment |
$7.75
billion |
$9.80
billion |
$10.17
billion |
$368.7
million |
$2.41
billion |
3.8% |
31.1% |
|
First Home Buyer |
$4.40
billion |
$4.97
billion |
$5.19
billion |
$217.6
million |
$789.3
million |
4.4% |
17.9% |
| Source: www.canstar.com.au. Based on ABS Lending Indicators, seasonally adjusted figures unless otherwise indicated. | |||||||
Canstar’s finance expert, Steve Mickebecker says,
“The housing market returned to boom conditions in March with total housing lending up by $839 million or 3.1 percent for the month. This is a huge 17.9 percent above March 2024, not at all what the Reserve Bank would be hoping for as it strives to slow spending.”
He further commented:
“Investment lending was up 3.8 percent in March and is a whopping 31.1 percent up from a year ago.
Rising house prices and an expectation of lower interest rates are encouraging investors into the market in gold rush proportions.
Fear of missing out as house prices rise is driving first home buyers to take the plunge and that group has topped the growth charts in March, up 4.4 percent for the month.
First home buyer lending is up 17.9 percent for the year. They will be pitting themselves against investors at auctions as the market heats up.
Even formerly reluctant upgraders are regaining confidence, up 2.1 percent for the month and a respectable 8.8 percent ahead of last year.
Expectations of lower interest rates and rising house prices are driving all sorts of buyers back into the market, which is starting to look like the boom times of 2021 before rate rises hit.
The latest higher inflation numbers will likely mean lower interest rates are further off and could dent this confidence in coming months, but buyer sentiment is strong.
Refinancing is the one part of the housing lending market that has stalled, with refinancing to a new lender down for the month by 2.5 percent.
It is now down $5.5 billion from its all-time high of $21.5 billion in July 2023.
Maybe the prospect of longer delays for interest rate cuts after the March quarter inflation data will bring back refinancers.”
Fixed rate loans out of favour
The proportion of borrowers opting for a fixed rate hit a new record low of just 1.40 per cent in March, according to ABS statistics released today.
The latest ABS lending indicators, released today, show just $664 million worth of loans opted for a fixed rate, out of the $47.5 billion worth of new and refinanced loans approved in the month of March.
February was the previous record low of just 1.44 per cent.
The peak in the popularity of fixing in Australia was back in July 2022 when 46 per cent of all new and refinanced loans opted for a fixed rate.
Average loan sizes
Average new owner-occupier loan sizes largely increased across the country this month, with notable gains in the Northern Territory, South Australia and Western Australia from the previous month.
Since the start of the rate hikes, the average loan sizes have risen in five states and territories, with the biggest increases recorded in South Australia (+11.1%), Western Australia (+10.7%) and Queensland (+8.4%), despite the 13 RBA rate hikes.
Only New South Wales, Victoria and the ACT have seen the average new owner-occupier loan sizes drop since the start of the hikes.
Average new loan sizes – owner-occupier mortgages
| Amount | Monthly change | Since start of rate hikes | |
| Australia | $607,963 | +$9,339 | -$3,191 |
| +1.6% | -0.5% | ||
| NSW | $744,101 | +$22,502 | -$41,934 |
| +3.1% | -5.3% | ||
| VIC | $590,475 | -$12,667 | -$46,793 |
| -2.1% | -7.3% | ||
| QLD | $571,954 | +$10,329 | +$44,502 |
| +1.8% | +8.4% | ||
| SA | $519,165 | +$18,231 | +$51,880 |
| +3.6% | +11.1% | ||
| WA | $521,863 | +$15,859 | +$50,374 |
| +3.1% | +10.7% | ||
| TAS | $461,961 | +$24,882 | +$14,183 |
| +5.7% | +3.2% | ||
| NT | $461,538 | +$32,042 | +$35,026 |
| +7.5% | +8.2% | ||
| ACT | $579,259 | -$49,152 | -$17,062 |
| -7.8% | -2.9% |
Source: ABS lending indicators, original data. Owner-occupier loans only, excludes refinancing.
RateCity.com.au research director, Sally Tindall, said:
“Fixed rates continue to sink to new lows as borrowers wait with bated breath to get a clearer idea of what the RBA’s next move will be.”
“The refinancing storm is well and truly over, with the value of loans switching to a different lender in March dropping to just $16.02 billion,” she said.
“While in dollar terms there is still an impressive amount of loans jumping ship, it’s the lowest level since well before the start of the rate hikes and yet another sign the refinancing market is settling into a much cooler new norm.
“The value of new loans approved in March has risen sharply since the same time a year ago, as buyers battle it out to place the winning bid on a limited amount of stock.
“Investor lending, in particular, has risen by a massive 31 per cent compared to the same time a year ago, despite the fact we’ve had three more RBA hikes within this time.
‘It’s amazing to see what the lure of potential capital gains can have on the market,” she said.
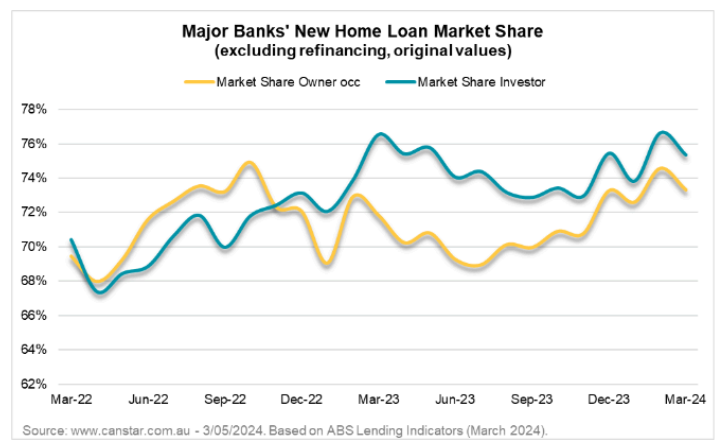
Big Four dominate new loan commitments
The major banks have increased their market share of new lending with borrowers opting to send 74.08% of new loans in March to a Big Four bank.
This has increased from 69.80% in March 2022, before the first cash rate rise in the current hiking cycle.
Investors lead the pack with 75.35% of new loan commitments being settled with a major lender compared to 73.33% of owner-occupied loans.
These percentages have increased since March 2022, before the rate rises when 70.42% of investor and 69.47% owner occupied loans were settled with a Big Four bank.
“The last two years have seen the big banks strike back, lifting their share of the market by 4.3 percent.
Now three in four dollars lent for dwellings is coming from one of the big four providers and their rise is looking relentless,” says Canstar’s Steve Mickebecker.
He further said:
“The big banks emerged from COVID lockdowns flush with deposits and until recently have been under no great pressure to pay savers high rates to attract funding, allowing them to compete in the housing loan market more aggressively.
“While not all of the big lenders are at the bottom end of the interest rate range, they are offering rates that are competitive enough when augmented by distribution and brand power.
Borrowers might have to look amongst the big bank’s secondary brands to find the best of their home loan rates.”
Borrowers can’t let a big brand name get in the way of a good deal
Fewer borrowers were seeking a better deal in March, with the value of existing loans refinanced to a new lender falling by 2.5% compared to February.
A total of $16.02 billion in loans were switched to a new lender during March, which is still a far cry from the $21.5 billion at the peak in July 2023.
| ABS Lending Indicators – Refinancing Activity | |||||||
|
Mar-23 |
Feb-24 |
Mar-24 |
Difference | % Change | |||
| MoM | YoY | MoM | YoY | ||||
| Value of refinancing to a new lender | |||||||
|
Total |
$21.33
billion |
$16.43
billion |
$16.02
billion |
-$413.7
million |
-$5.31
billion |
-2.5% |
-24.9% |
|
Owner Occupied |
$14.23
billion |
$10.60
billion |
$10.27
billion |
-$332.6
million |
-$3.96
billion |
-3.1% |
-27.8% |
|
Investment |
$7.10
billion |
$5.83
billion |
$5.75
billion |
-$81.1
million |
-$1.35
billion |
-1.4% |
-19.0% |
| Source: www.canstar.com.au. Based on ABS Lending Indicators, seasonally adjusted figures unless otherwise indicated. | |||||||
Canstar’s analysis indicates that a borrower, currently repaying their loan at 6.57% (the average rate of the Big Four banks’ lowest variable rate offers), with monthly repayments of $3,820, could save significantly by switching.
| Lowest Home Loan Rates | |||||
|
Loan Type |
Lowest in Market |
ANZ |
CBA |
NAB |
Westpac |
| Variable | 5.75% | 6.54% | 6.49% | 6.79% | 6.44% (Reverts to
6.84% after 2 years) |
| 1 Year Fixed | 5.79% | 6.69% | 6.59% | 6.69% | 6.59% |
| 2 Year Fixed | 5.63% | 6.54% | 6.84% | 6.59% | 6.49% |
| 3 Year Fixed | 5.48% | 6.59% | 6.59% | 6.59% | 6.59% |
| 4 Year Fixed | 5.69% | 6.74% | 6.69% | 6.74% | 6.59% |
| 5 Year Fixed | 5.59% | 6.84% | 6.69% | 6.79% | 6.69% |
| Source: www.canstar.com.au – 3/05/2024. Based on Owner Occupier home loan rates on Canstar’s database, available for a $600k, any LVR, P&I loan. | |||||
Canstar encourages borrowers not to let a big brand lender keep them from securing a better deal with a lesser-known provider.
“Canstar’s analysis shows the 4.25 percentage point increase in the cash rate since the beginning of May 2022 adds approximately $1,562 to repayments on a $600,000 loan over 30 years or $2,603 on a $1 million loan,” says Mickenbecker.
He explained:
“While some borrowers aren’t waiting for the Reserve Bank to instigate a rate cut, the message to other borrowers is don’t wait, make the cut happen for yourself.
The higher quarterly inflation figure reported for March means relief for borrowers is likely to be further off if they leave it in the hands of the Reserve Bank.
Borrowers can easily be drawn to the comfort of just the lenders they know, when being open to a wide range of options can potentially secure a more competitive rate, and usually come with the flexibility to make extra repayments and the ability to redraw them if needed.
If the lure of the major banks is too appealing then consider that even the big four banks have much more competitive rates with their subsidiary brands.”


