


Key takeaways
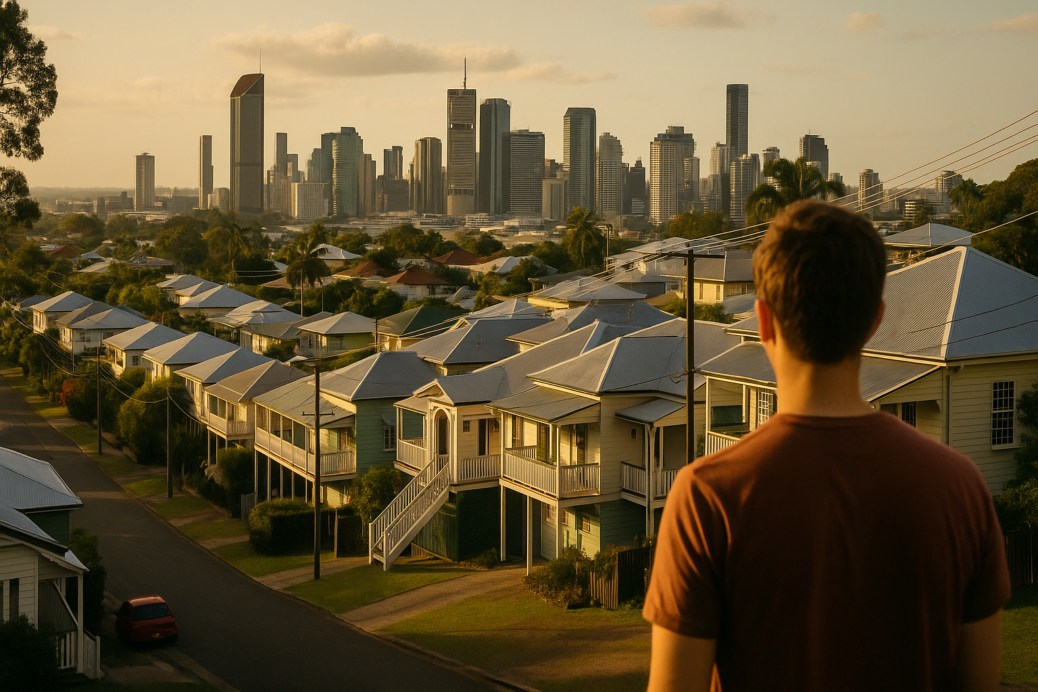
Brisbane’s house prices are rising faster than buyer budgets, especially in inner suburbs.
Within 10km of the CBD, buyers are searching at around $1.1 million, but listings are $1.45 million , a $350,000 affordability gap.
In premium suburbs like Brisbane Inner, Inner North, and Sherwood–Indooroopilly, this gap stretches to $800,000, pricing out many middle-income earners.
The Brisbane property market is heating up, but not in the way many property buyers hoped.
Brisbane’s property market is outpacing homebuyers’ budgets, and the gap is growing, according to Domain’s latest Matching Demand report.
This latest research confirms that the city’s housing affordability crisis isn’t just a headline; it’s playing out suburb by suburb, with inner-city buyers now grappling with a median shortfall of $350,000.
And in some of the city’s most desirable suburbs, the gap blows out to as much as $800,000.
As property investors, understanding this growing misalignment between buyer budgets and listing prices is crucial.
It provides insight into where the market is heading, what buyers are prioritising, and where the real opportunities may lie.

Inner Brisbane: aspirational… but no longer attainable
Let’s start with the numbers.
According to Domain, within 10km of Brisbane’s CBD, buyers are typically searching for houses priced around $1.1 million, but the median listing price is $1.45 million.
That’s a $350,000 shortfall.
In sought-after pockets like Brisbane Inner, Brisbane Inner North, and Sherwood–Indooroopilly, the mismatch is even more pronounced, with shortfalls ranging from $500,000 to $800,000.
Table 1. The highs and lows of the price alignment, houses.
| Listing price is above buyer search price | Listing price is below buyer search price |
| Brisbane Inner, $800,000 (66.7%) | Beaudesert, -$52,500 (-7.0%) |
| Brisbane Inner North, $700,000 (58.3%) | Ipswich Hinterland, -$10,000 (-1.4%) |
| Brisbane Inner West, $600,000 (46.2%) | Cleveland-Stradbroke, -$739 (-0.1%) |
| Brisbane Inner East, $565,000 (47.1%) | |
| Sherwood-Indooroopilly, $500,000 (41.7%) | |
| Based on ABS SA3 geography. | |
This means many middle-class buyers are being priced out of their preferred suburbs.
Suburbs that were once considered “aspirational but attainable” have slipped out of reach.
And it’s not just a psychological barrier, it’s a financial gap that’s altering buyer behaviour.
Dr Nicola Powell, Domain’s Chief of Research and Economics, put it bluntly:
“Brisbane’s rapid property price growth is forcing many buyers to make tough trade-offs, either compromising on location or adjusting their expectations around property type.”
For investors, this shift is an important indication of what’s going on in the market at present – demand is not disappearing, it’s being redirected.
The pivot to medium and high-density living
One of the more revealing aspects of the Domain report is how buyer preferences are evolving.

Note: As affordability pressures bite, buyers are gravitating toward townhouses and units, particularly in well-located middle- and outer-ring suburbs.
In fact, buyer search data shows that budgets are higher than listing prices for many medium-density dwellings.
For example:
-
In the outer suburbs (30 km+ from the CBD), townhouse seekers are budgeting up to $100,000 more than current listings.
-
For units, the mismatch is even starker—buyers are prepared to pay up to $301,000 above the average asking price in some outer areas.
Table 2. The price difference between seller and buyer expectations (listing price v searched price).
| < 10km | 10-20km | 20-30km | 30-40km | 40km+ | |
| House – Listing Price | $1,450,000 | $936,000 | $800,000 | $742,000 | $770,000 |
| House – Searched Price | $1,100,000 | $850,000 | $750,000 | $750,000 | $800,000 |
| House – Price Difference | $350,000 | $86,000 | $50,000 | -$8,000 | -$30,000 |
| Townhouse – Listing Price | $843,000 | $625,000 | $555,000 | $519,000 | $600,000 |
| Townhouse – Searched Price | $850,000 | $650,000 | $600,000 | $600,000 | $700,000 |
| Townhouse – Price Difference | -$7,000 | -$25,000 | -$45,000 | -$81,000 | -$100,000 |
| Unit – Listing Price | $638,000 | $520,000 | $629,000 | $379,000 | $599,000 |
| Unit – Searched Price | $700,000 | $650,000 | $650,000 | $600,000 | $900,000 |
| Unit – Price Difference | -$62,000 | -$130,000 | -$21,000 | -$221,000 | -$301,000 |
This clearly points to a supply-side issue.
There simply aren’t enough larger, quality townhouses and apartments to meet the rising demand from downsizers, young families, and first-home buyers priced out of the detached home market.
As Dr Powell explains:
“We’re seeing sustained demand for well-located, medium and high-density housing like townhouses, apartments, and mixed-use developments within 20 kilometres of the CBD, as well as increased interest in outer suburban areas and growth corridors.”
In my view, this shift isn’t temporary; it’s structural.
It’s a response not just to pricing, but also to lifestyle, demographic change, and flexibility in how and where people work.
The new geography of demand: decentralisation accelerates
The pandemic has permanently altered where people choose to live.
According to Domain, since 2020:
This decentralisation trend is being fuelled by a combination of affordability constraints, remote work flexibility, and rapid population growth in Southeast Queensland.
In the outer-ring suburbs—30 to 40km from the CBD—buyers are actually overbudgeted by around $8,000, with searched prices exceeding listing prices.
This suggests these areas are undervalued relative to demand and could be on the cusp of significant capital growth if supply doesn’t catch up.
There’s also strong evidence of pent-up demand in growth corridors like Ipswich, Beaudesert, and Cleveland–Stradbroke, where listing prices are currently below what buyers are searching for.
What this means for investors
As always, seasoned investors will look beyond the headlines to uncover opportunity in the data.
Here’s how I interpret Domain’s findings:
1. Premium suburbs have enjoyed significant growth.
Many of Brisbane’s inner and middle-ring suburbs have enjoyed significant capital growth over the last 4 years.
While the “average” homebuyer or investor will be priced out of these areas more affluent owner occupiers, those who already have significant equity in their properties or downsizes will keep buying in these locations underpinning property values.
They will be prepared to pay to live in Brisbane’s top suburbs because they provide lifestyle and amenity.
These will also make great suburbs for property investors as tenants are prepared to pay a premium to live in the suburbs.
2. Townhouses and larger units are an undersupplied asset class
This is one of the clearest investment signals in the report.
There is a strong and growing demand for larger, high-quality medium-density homes, but not enough supply.
This creates an opportunity for developers and investors alike, particularly near transport, schools, and job hubs.
3. Outer suburbs still offer value, but be selective
Not all outer suburbs are created equal.
Look for areas with strong population growth, infrastructure investment, and lifestyle appeal.
As affordability pushes more buyers further out, demand in these locations is likely to rise.
4. The market wants more than just dwellings; it wants lifestyle, community, and flexibility
As Dr Powell points out, the challenge now for planners and developers is to deliver “liveable, future-ready communities that align with where and how people want to live.”
Investors who understand this—and target assets accordingly—will be better positioned for long-term growth.
Final thoughts
The Brisbane property market is evolving and buyers are adapting to affordability constraints.
On the other hand those already holding Brisbane real estate are getting rich as the value of their properties keeping increasing, while for many the rising cost of living is creating financial struggles.
This means there will be more tenants in the future
But there will be 2 types of tenants
-
Lifestyle tenants
-
Tenants who are low income earners – 1-2 weeks away from being broke. They won’t be able to sustain rental increase. Don’t buy properties where your tenants are 1-2 weeks away from being broke.
My advice is don’t invest in the lower socio economic regions of brisbane where people can’t afford to pay more for each others property.
Yet many investors like to buy cheap – WRONG!
Instead I’d be buying in Brisbane aspirational and gentrifying suburbs.
I believe we’re in a window of opportunity for property investors who take a long-term view.
Right now, we’re seeing what some would call a “perfect storm” of fundamentals that are aligning to support strong property markets in the years ahead:
- Continued rapid population growth is putting pressure on housing.
- An acute undersupply of dwellings,
- A chronic shortage of skilled labour, making new development slower and more expensive.
- Inflation has moderated, now sitting within the RBA’s target range.
- Interest rates will keep falling – bringing more buyers into the market
- Government first homebuyer incentives will pour fuel on the flames of our undersupplied housing market.
As interest rates keep falling and confidence returns among both buyers and sellers, we’ll enter the next phase of the property cycle.
And historically, this stage has delivered some of the best capital growth for those who act early.
But what about you?
Are you clear on how to take advantage of these market conditions — or are you still waiting for “certainty”?
That’s where our Complimentary Wealth Discovery Session comes in. We’re offering you a 1-on-1 chat with a Metropole Wealth Strategist to help you:
- Clarify your financial goals
- Understand how macro trends affect your position
- Build a personalised, data-driven property strategy
- Get ahead of the curve — before everyone else piles in
There’s no cost, no obligation — just practical, tailored guidance based on decades of experience.
Click here now to book your free Wealth Discovery Session