


Key takeaways
National dwelling values rose by 0.6% in July, with the rate of growth holding firm relative to the prior two months.
Every capital city recorded a rise in dwelling values through the month – led by Darwin with a solid 2.2% rise, followed by Perth, up 0.9%. At the softer end of the growth tables are Hobart (+0.1%), Melbourne (+0.4%) and the ACT (+0.5%).
The opposing influence of low supply, falling interest rates and rising confidence run up against affordability constraints and lingering uncertainty.
The combined regional markets (1.7%) are no longer outperforming, with the rolling quarterly gain once again favouring the combined capitals (1.8%).
Housing affordability poses the most significant barrier to a material rise in housing prices.
National dwelling values rose by 0.6% in July, with the rate of growth holding firm relative to the prior two months, according to Cotality’s latest Home Value Index.
That marks the sixth straight month of gains, with the positive inflection aligning with the first rate cut in February.
At the national level, the pace of growth in housing values is no longer accelerating.
Rather, we have seen growth rates holding a little above half a percent from month to month since May as the opposing influence of low supply, falling interest rates and rising confidence run up against affordability constraints and lingering uncertainty.
Every capital city recorded a rise in dwelling values through the month, led by Darwin with a solid 2.2% rise, followed by Perth, up 0.9%.
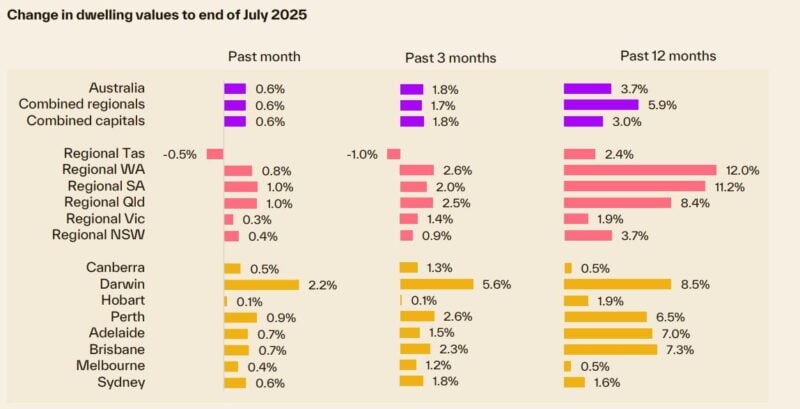
At the softer end of the growth tables are Hobart (+0.1%), Melbourne (+0.4%) and the ACT (+0.5%).
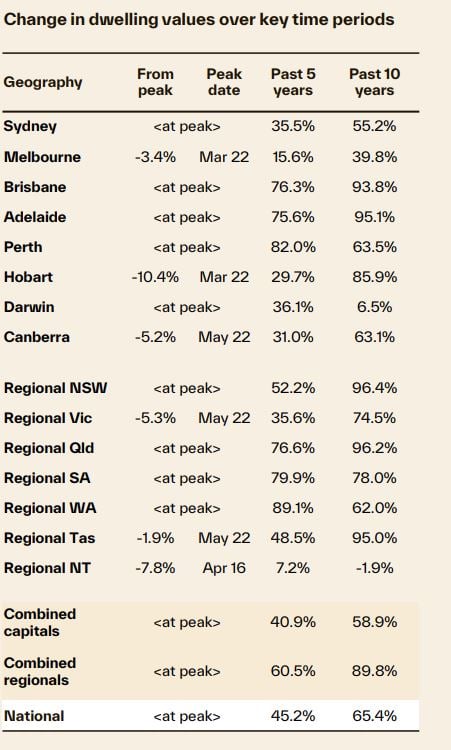
While the Darwin trend doesn’t have much influence on the headline numbers, the Top End capital has moved into a solid upswing, posting a 9.7% gain through the first seven months of the year.
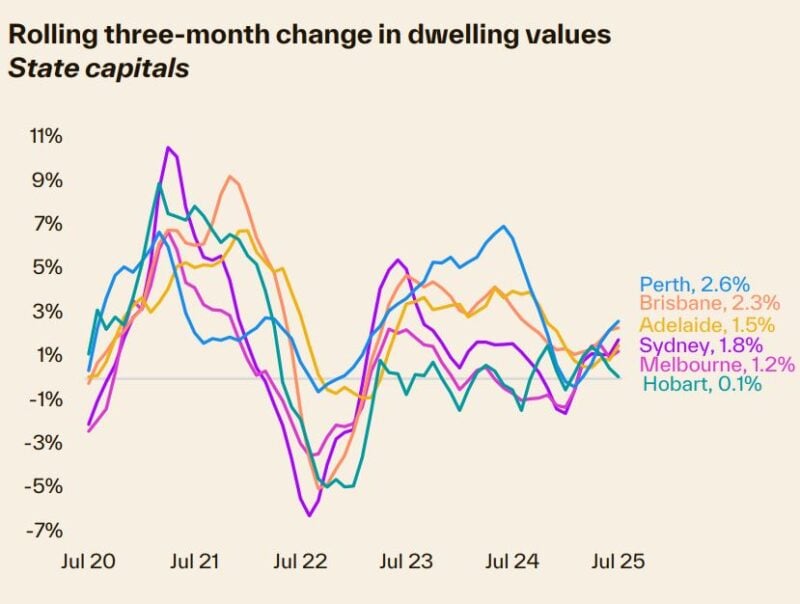
The mid-sized capitals are also once again standing out, especially Perth, where the monthly pace of gains has accelerated to the fastest rate of growth since September last year.
The positive trend in housing values is supported by persistently low inventory levels, with national listings tracking -19% below the previous five-year average for this time of the year.
At the same time, Cotality’s estimate of annual sales is tracking about 1.9% above the previous five- year average.
The imbalance between available supply and demonstrated demand has supported auction clearance rates, which have been tracking slightly above the decade average since mid-May.
Although the monthly growth trend looks to have found a sweet spot around 0.6%, the rolling quarterly change shows a clear upswing.
The 1.8% rise in the national index over the three months ending July was the strongest outcome since the three months ending June last year (+2.0%).
Index results as at 31st July 2025
Source: Cotality HVI 1st August 2025.
The rate of growth in house values is once again outpacing gains across the unit sector
The past three months have seen national house values rise by 1.9%, adding approximately $16,700 to the median value.
In comparison, unit values are up a smaller 1.4% or roughly $9,700 on the median value.
This may be because more expensive markets tend to have higher interest rate sensitivity, with higher- income households seeing a bigger boost to borrowing capacity.
This usually leads to house values outperforming units during housing market upswings.
The difference between the national median house and unit value is at a record high, with a 32.3% difference between the two broad housing types, or approximately $223,000 in dollar terms.
Such a wide difference comes amid ongoing affordability constraints and a lack of newly built multi-unit housing supply, which seems counter-intuitive.
Clearly, demand preferences are still weighted towards detached housing options despite the substantially lower price points available across the unit sector.
The combined regional markets are no longer outperforming
The combined regional markets (1.7%) are no longer outperforming, with the rolling quarterly gain once again favouring the combined capitals (1.8%).
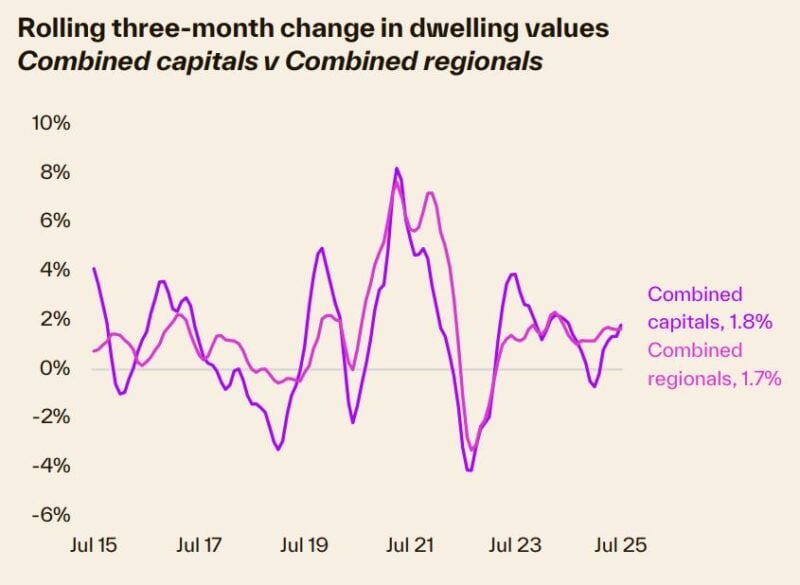
The stronger capital city trend comes after nine months where the quarterly trend rate of growth has been stronger across regional Australia.
The stronger capital city trend isn’t evident everywhere, with regional markets in Vic (1.4%), Qld (2.5%) and SA (2.0%) continuing to outperform their capital city counterparts (1.2%, 2.3% and 1.5% respectively).
Outlook
The outlook for housing values remains positive.
We expect values to continue posting a broad-based but modest rise through the rest of the year, supported by an outlook for lower interest rates, improving sentiment and short housing supply.
The June quarter inflation outcome, with the quarterly trimmed mean at 0.6% and the annual core inflation reading reducing to 2.7% (lowest since Sep 2021), sets the scene for an August rate cut and probably two or three more over the coming 12 months.
The housing component of CPI, which holds the most significant weighting in the CPI calculation, is one to watch, with a rise in annual inflation through the first half of the year from 1.0% at the end of 2024 to 2.0% in June due to the expiry of federal and state energy rebates.
Given that core inflation is now firmly around the mid- point of the RBA’s target range, there is a clear expectation that interest rates will reduce further from here.
Lower interest rates go well beyond providing a lift to home loan serviceability and borrowing capacity.
We expect to see a further rise in consumer sentiment as cost-of-living pressures are contained and the cash rate moves lower.
Historically, consumer sentiment and housing activity have shown a close relationship.
Low housing supply is another factor supporting some upward pressure on housing values, both from an ‘immediate’ perspective via low advertised listing numbers, but also insufficient newly built housing supply that is likely to be a feature of the market for some time yet.
Building costs remain high and profit margins have been severely compressed, especially across the multi-unit sector.
Given the persistently below average trend in dwelling approvals, alongside extended approval-to-completion times and competition for labour with the public infrastructure sector, it’s hard to see the cumulative shortfall in newly built homes being addressed within the next couple of years at least.
Despite the tailwinds of lower interest rates, improving sentiment and ongoing low supply, the housing market is also facing a few headwinds.
Housing affordability poses the most significant barrier to a material rise in housing prices.
Data to March shows the national dwelling value to household income ratio, at 7.9, is just shy of record highs.
Although loan serviceability metrics are improving as rates reduce, higher housing prices are dampening the influence of lower rates.
Elevated levels of household debt are another factor blocking a more material rise in home values.
Recent statements from the Council of Financial Regulators and APRA make it clear that regulators are watchful for any sign of excessive debt accumulation as financial conditions ease.
Other downside factors for the housing sector include the uncertainty related to geopolitical risk and tension in conflict zones such as the Middle East and Ukraine, as well as more ‘normal’ levels of population growth that should help to dampen demand-side factors.
On balance, the tailwinds of lower interest rates, higher confidence and low housing supply are likely to outweigh the headwinds, providing the foundations for further modest growth in housing values in 2025.